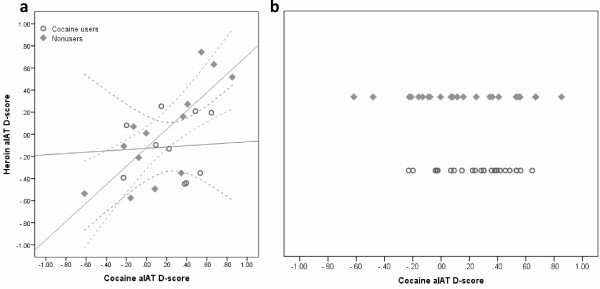
Figure 4.

Individual cocaine and heroin D-scores. (a) Relationship between cocaine and heroin D-scores; line represents the simple linear regression model fitted to the group data independently, with 95%CI of the mean. (b) Dispersion of cocaine D-scores in the cocaine user and non-user comparison groups.
