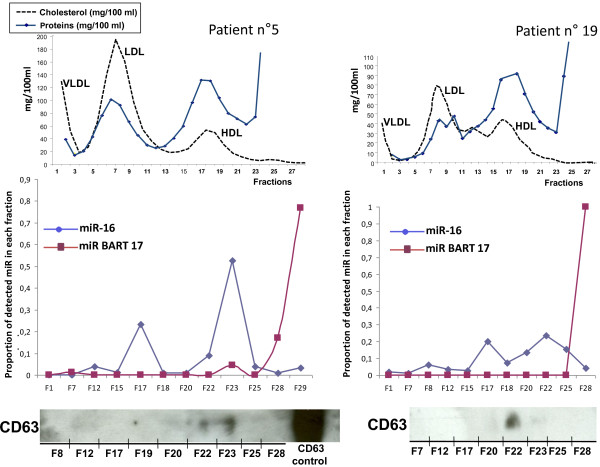
Figure 6.
Distribution of miR-BART 17 in plasma fractions obtained by flotation on a potassium bromide gradient. Three mL plasma aliquots from 2 NPC patients (n°5 and 19) were fractionated as described in the Materials and Methods section. Top panels. Twenty nine fractions were analyzed for their cholesterol (dotted black line) and protein (solid blue line) contents. From the top to the bottom of the gradient, three major cholesterol peaks allow identification of fractions containing VLDL (<1.006 g/mL), LDL (1.019 to 1.063 g/mL) and HDL (1.06 to 1.13 g/mL). Protein concentration was maximal at the bottom of the gradient. Within fractions 25 to 28, it goes above 1000 mg/100mL. Middle panels. Concentrations of miR-16, miR-BART17 and cel-miR-39 were determined in 11 to 12 selected fractions evenly distributed through the gradient. They are presented as the ratio of the number of microRNA copies contained in each fraction to the sum of the copies contained in all fractions. MiR-16 is mainly distributed in 2 peaks: one small peak coincident with fraction 17 and one bigger peak coincident with the portion of the gradient containing the exosomes. In contrast, miR-BART17 is recovered almost exclusively in the bottom fraction. Bottom panels. Detection of the CD63 protein by Western blot analysis in a set of selected fractions. After long exposure, CD63 signals are detected in fractions 22 and 23 (NPC patient n°5, left panel) and fraction 22 (NPC patient n°19, right panel). The densities of these fractions are in the range classically attributed to exosomes (1.15 to 1.19 g/mL).

