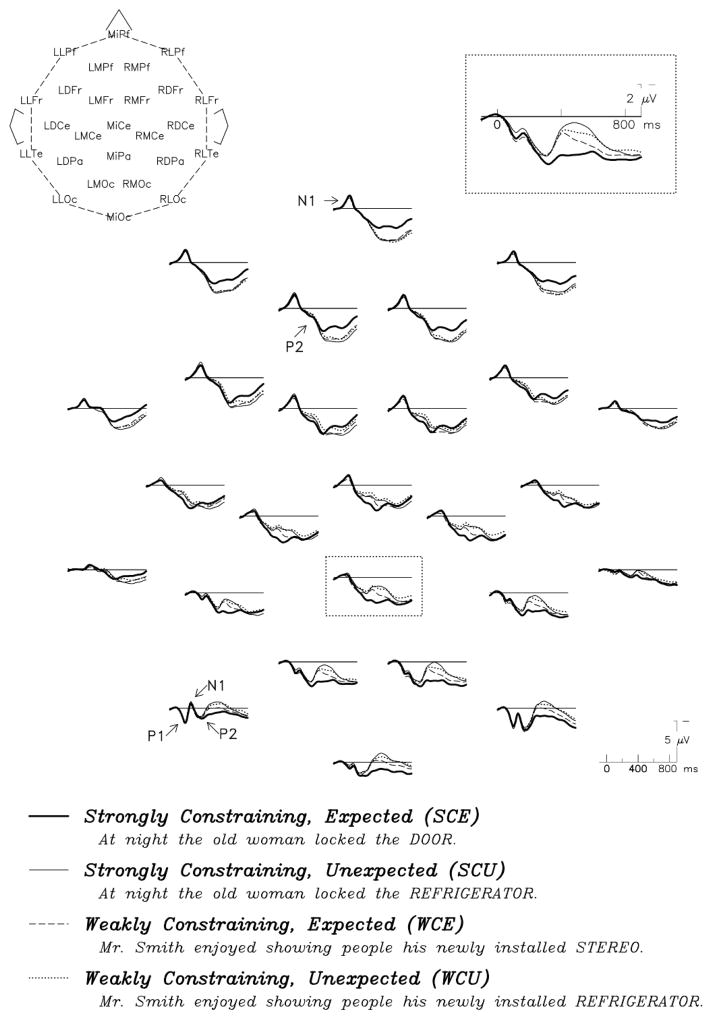
Figure 1.
Sentence-final ERPs from all four experimental conditions, arranged as laid out over the head. A schematic showing electrode positions with labels is at top left. The inset (top right) contains an enlarged view of the middle parietal channel (boxed). Sensory components are labeled. At posterior sites, the negative-going wave peaking around 400 ms is the N400 component. The later negative-going effect for the SCE condition is visible at anterior sites. Negative is plotted up.

