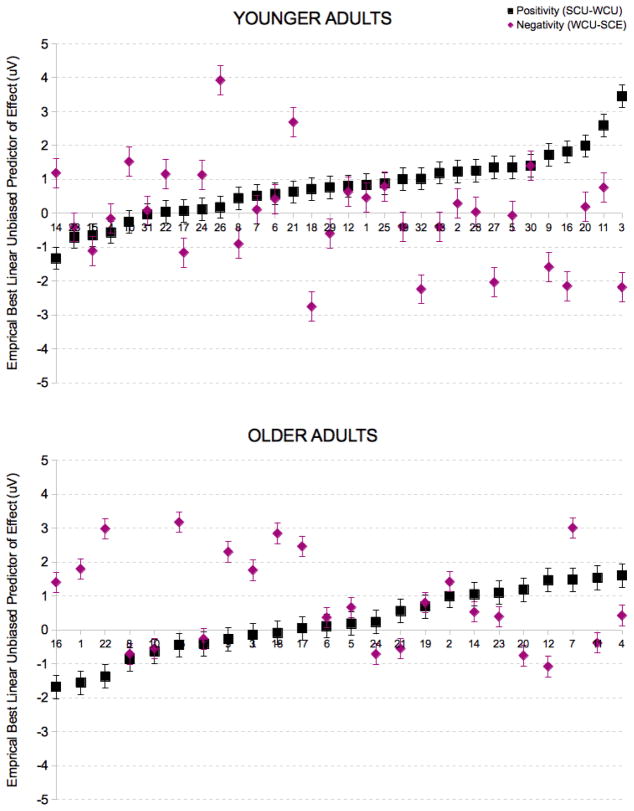
Figure 5.
Empirical Best Linear Unbiased Predictors (EBLUPs) for the SCU vs WCU (frontal positivity) and WCU vs SCE (frontal negativity) comparisons, by age group. More positive values indicate a larger effect (a larger positivity to the SCU compared to WCU condition; or a larger relative negativity to the SCE compared to WCU condition). Participants in each age group are ordered from smallest to largest estimate of the frontal positivity effect. Whereas most younger adults show a positive value for the frontal positivity effect, only about half of the older adults do (and only about one-fourth show positive effect greater than 1 μV). However, more older than younger adults show a positive value for the WCU vs SCE comparison (a larger negativity for the SCE condition). This pattern is very similar for the full group of 32 participants from Federmeier et al. (2007) as well as the randomly selected 24 (participants 6, 7, 11, 12, 24, 29, 30, and 31 were not included the random subset of participants).

