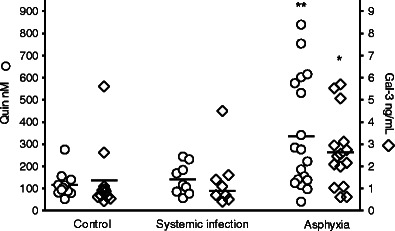
Fig. 1.

CSF concentrations of QUIN and galectin-3. The asphyxia group (n = 20) had significantly higher concentrations of QUIN (p < 0.01) and galectin-3 (p < 0.05) than the control group (n = 15), while the infection group (n = 10) did not differ from controls (Kruskal–Wallis test with Dunn's correction). Crossbars represent mean
