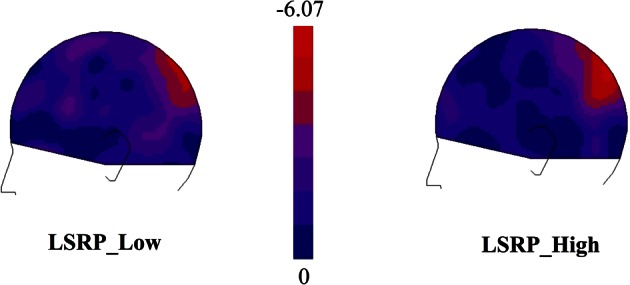
Figure 3.

Subtraction maps created to identify the ROI electrodes [66-67-71, in the EGI system (HCGSN) corresponding to P3 in the 10–20 systems] in which the somatosensory gating (SG) was showing the greatest modulation during the first two pictures (0:1000 ms) in comparison to the Cross Baseline (−1000:0 ms).
