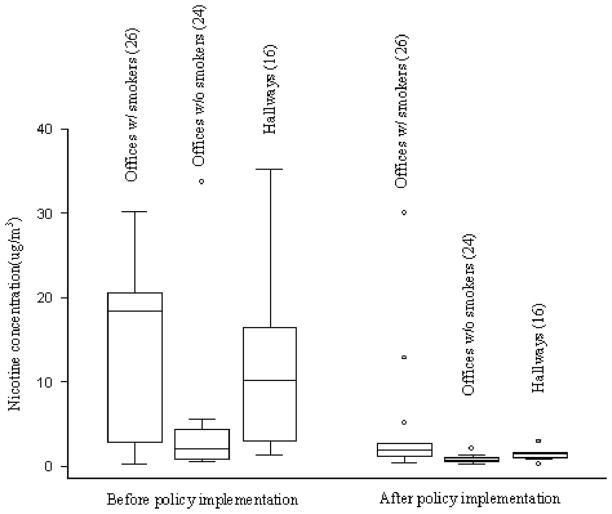
Fig. 2.
Comparison of nicotine concentrations in offices and hallways before and after the implementation of smoke-free policy in an office building (2 samples above 40 μg/m3 from offices with at least one smoker before the implementation of the policy were not shown in the graph: 56.4 and 80.16 μg/m3; the number of samples in each location is shown inside parentheses).

