
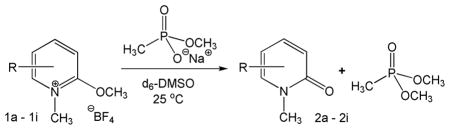
Table 1.
Methylation of Model Systema
| ||||
|---|---|---|---|---|
| entry | R = | kMe | khyd | kMe/kMeH |
| 1a | H | 4.6 ± 0.1 × 10⁻⁵ | 2.8 ± 0.2 × 10⁻⁶ | 1 |
| 1b | 3-F | 3.1 ± 0.1 × 10⁻² | 1.1 ± 0.1 × 10⁻³ | 670 |
| 1c | 5-F | 1.6 ± 0.2 × 10⁻⁴ | NDb | 3.5 |
| 1d | 5-CF3 | 2.83 ± 0.03 × 10⁻³ | 6.0 ± 0.1 × 10⁻⁴ | 60 |
| 1e | 6-CF3 | 4.63 ± 0.08 × 10⁻³ | 8.7 ± 0.2 × 10⁻⁴ | 100 |
| 1f | 5-NO2 | 5.6 ± 0.1 × 10⁻³ | 2.2 ± 0.1 × 10⁻² | 120 |
| 1g | 4-CN | 2.47 ± 0.06 × 10⁻³ | 3.3 ± 0.2 × 10⁻⁴ | 50 |
| 1h | 5-CN | 5.13 ± 0.07 × 10⁻³ | 3.9 ± 0.1 × 10⁻³ | 110 |
| 1i | 6-CN | 5.8 ± 0.2 × 10⁻³ | 2.1 ± 0.1 × 10⁻³ | 125 |
a
Reactions were conducted in d6-DMSO at 25.0 ± 0.5 °C and were monitored by 1H NMR spectroscopy at 500 MHz.
b
ND = not determined.