
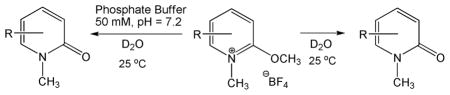
Table 2.
Rate Constants of Hydrolysisa
| |||
|---|---|---|---|
| entry | R = | khyd in D2O | khyd in bufferb |
| 1a | H | NDc | NDc |
| 1b | 3-F | 2.3 ± 0.2 × 10⁻⁵ | 7.1 ± 0.3 × 10⁻⁵ |
| 1c | 5-F | NDc | NDc |
| 1d | 5-CF3 | 1.10 ± 0.05 × 10⁻⁶ | 7.0 ± 0.5 × 10⁻⁵ |
| 1e | 6-CF3 | NDc | 1.20 ± 0.06 x10⁻⁴ |
| 1f | 5-NO2 | 6.4 ± 0.4 × 10⁻⁵ | 2.40 ± 0.07 × 10⁻³ |
| 1g | 4-CN | 1.40 ± 0.03 × 10⁻⁶ | 1.60 ± 0.04 × 10⁻⁴ |
| 1h | 5-CN | 1.40 ± 0.05 × 10⁻⁵ | 8.3 ± 0.2 × 10⁻⁴ |
| 1i | 6-CN | 4.1 ± 0.3 × 10⁻⁶ | 4.10 ± 0.04 × 10⁻⁴ |
a
Rate constants given in units of min−1 were determined by 1H NMR spectroscopy.
b
50 mM phosphate buffer pH = 7.2.
c
Not determined, the reaction was too slow to observe hydrolysis.