
Figure 1.
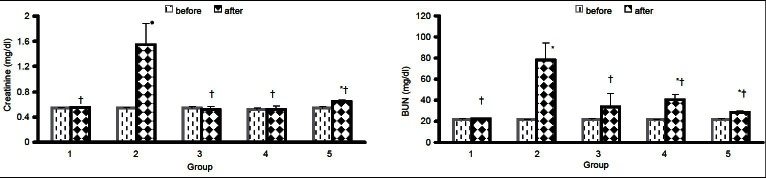
The serum levels of BUN and Cr before and after the experiment in five groups of animals. Group I, sham group; group II, positive control group treated with gentamicin; group III, treated with metformin; group IV, treated with gentamicin for 10 days and post-treatment with metformin for the next 10 days; and group V, co-administration of metformin and gentamicin for 10 days. The symbols (*) and (†) stand for significant difference before the experiment (P < 0.05) and significant difference from positive control group (P < 0.05), respectively