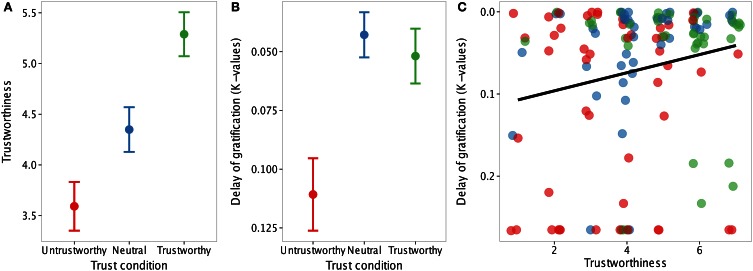
Figure 3.
(A) Perceived trustworthiness increased as a function of trust condition. Error bars are standard error. (B) Discounting rates were higher in the untrustworthy condition (red) compared to the neutral (blue) and trustworthy conditions (green), reflecting reduced willingness to delay gratification with untrustworthy individuals. y-axis is reversed for conceptual consistency. (C) Perceived trustworthiness correlates positively with discounting rates. Correlation (95% confidence interval of r: 0.02–0.36) was verified using non-parametric bootstrapping due to positive skew in discounting values. Individual data points are jittered 0.2 units on the x-axis for display purposes.

