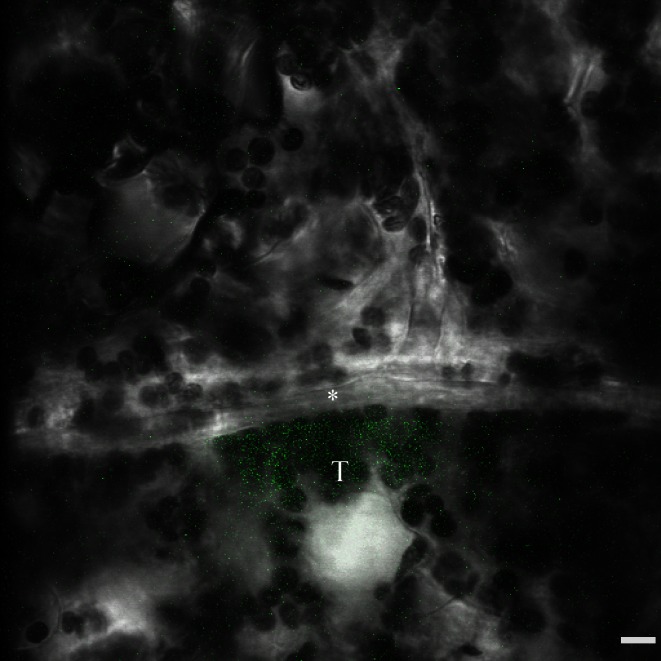
Figure A1.
Confocal image of a photoactivation experiment in a Cucurbita pepo leaf. The image shows a single optical section of a 30 μm thick z-stack that was recorded at one time point during the 10 s-long photoactivation phase. The fluorescence of the activated tracer is displayed as extended focus projection in green, overlaid over the brightfield image. In image analysis, three-dimensional regions of interest are drawn adjacent to the cell wall between the bundle sheath target cell (T) and the intermediary cell (*) in order to quantify diffusion of activated tracer. Scale bar: 10 μm.

