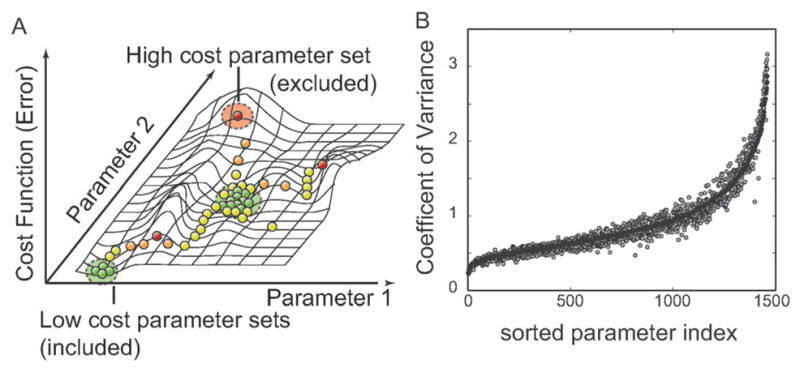
Fig. 2.

Parameter identification strategy. (A) Multiple Monte-Carlo trajectories were used to randomly explore parameter space. The simulation likelihood was used to generate a family of parameter sets used in the simulation study. We generated N = 2377 possible parameter sets and selected the 100 sets with the highest likelihood for inclusion in the ensemble. (B) Coefficient of Variation (CV; standard deviation of a parameter relative to its mean value) for the parameter ensemble used in this study. A small CV suggested a parameter was tightly constrained by the training data used for model identification. Black circles represent the CV values for the full N = 100 sets used in the ensemble. The gray circles indicate the CV values for a sub-ensemble (N = 47) selected from the main ensemble and used in the robustness analysis study. CV values were sorted from lowest to highest relative to the full ensemble.
