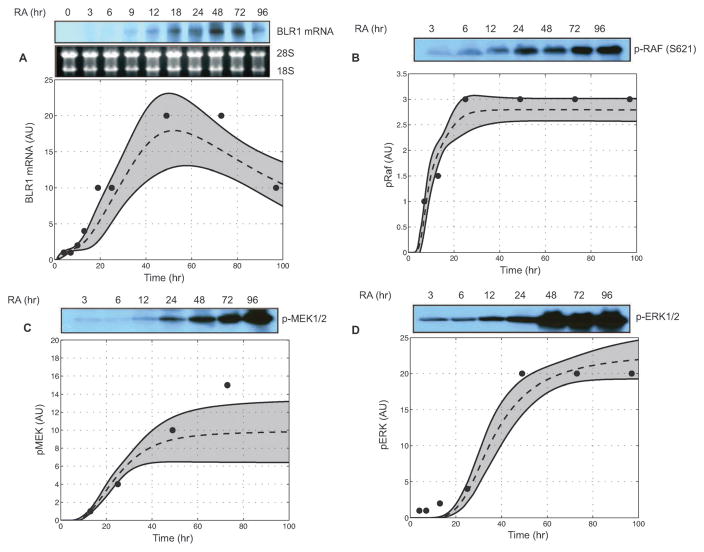
Fig. 3.
Model simulations over the parameter ensemble captured the sustained activation of MAPK following RA exposure (1 μM) at time=1 h. Dashed lines denote the simulation mean. Shaded regions denote one ensemble standard deviation. (A) Experimental and simulated levels of BLR1 mRNA following RA exposure. (B) Time profile of phosphorylated RAF1 activation following RA exposure. (C) Simulated versus measured phosphorylated MEK activation following RA exposure. (D) Simulated versus measured phosphorylated ERK following RA exposure. Data was adapted from Wang and Yen.21

