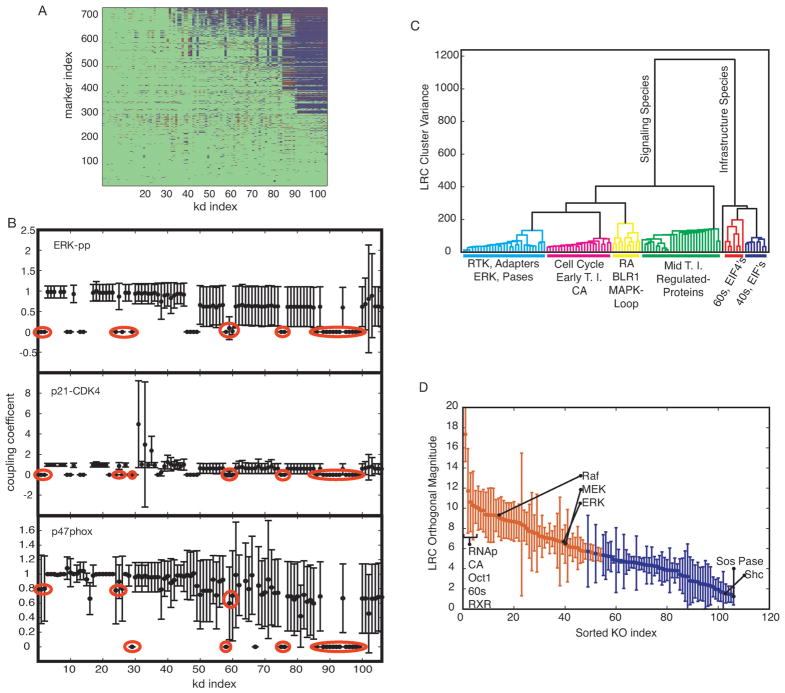
Fig. 6.
Robustness analysis. Each non-zero initial condition (conserved species) was removed, the model was run to approximate steady state and RA was added at time = 1 h. The area under the curve was calculated for each model species. (A) Qualitative coupling results. Removed species are along the x-axis from lowest to largest impact and observed model species are along the y-axis from least to most effected. Blue or red markers depict a statistical decrease or increase, respectively, in the area under the curve within a 90% confidence interval. (B) Coupling coefficients (area under the curve from the simulation with species removed over wild-type simulation) for three markers of differentiation: phosphorylated ERK, p47phox expression and p21-CDK4-cyclin D complex. Red circles indicate knock-downs which demonstrated a statistical decrease in all three markers: (left to right) RAR, RXR, BLR1, NFATc3, RNAp, eIF4E, Oct1, CREB, 40s and 60s ribosomes, met tRNA, EIF2, PABP, eIF4A, B, G, H, and eIF1, 1A, 3, 5, 5B. (C) Dendrogram of knockout species. The distance metric was the Euclidean norm and the linkage function was the inner square product (variance minimization algorithm). Each additional cluster is chosen to reduce the variance (y-axis). The color-threshold was chosen to be 200 which is 50% of the remaining variance after the initial division. General species and/or functions are indicated below each colored group. (D) Distinguishability is defined as the magnitude of the orthogonal components for all knockout species considered. Species are ordered from largest to smallest magnitudes. Red markers indicate species which are statistically significantly above 5. Specific species are identified as shown. Error bars show one standard deviation over the parameter ensemble.

