
Figure 5.
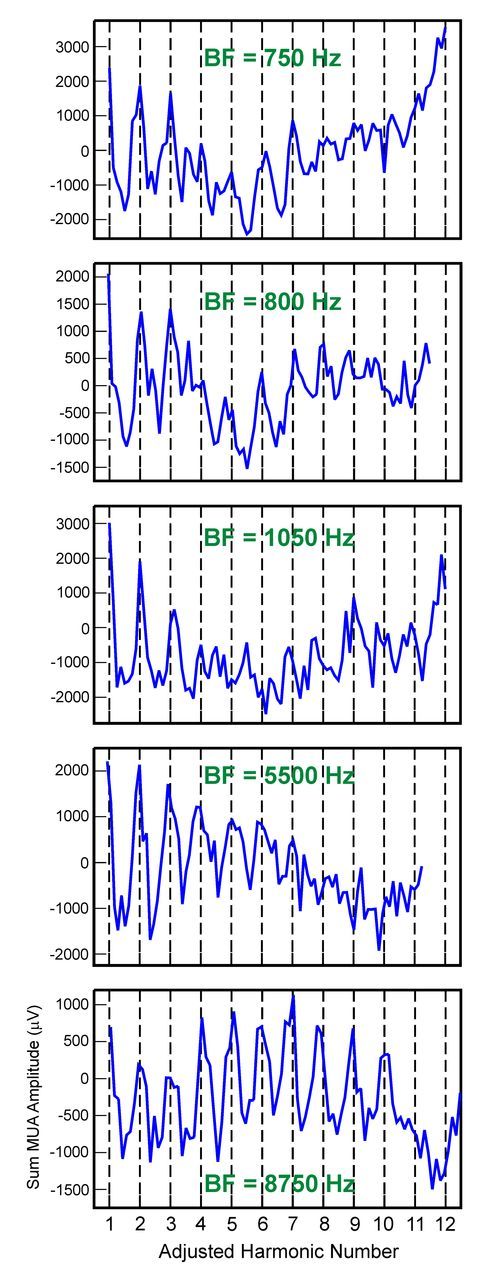
Rate-place profiles based on Total MUA recorded at five additional sites with different BFs. BFs of the sites are indicated in green. The x-axis of the rate-place profiles has been changed to adjusted harmonic number, as described in Materials and Methods. Note periodicity in rate-place profiles, with peaks in response amplitude occurring at or near integer values of harmonic number.