Figure 1.
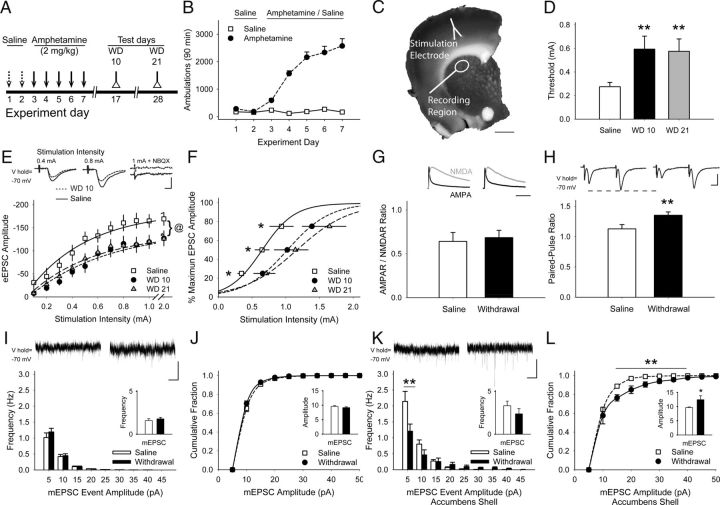
Repeated amphetamine causes CPD. A, Paradigm for testing synaptic plasticity after repeated amphetamine. Mice were treated with saline for 2 d, amphetamine for 5 d, and were killed for experiments on WD 10 or 21. B, Representative locomotor ambulations in mice treated with either saline or amphetamine (n = 4 each). C, Coronal corticostriatal slice, stained with FM1-43 and 3,3′-diaminobenzidine, shows the areas of stimulation and recording. D, Compared with saline-exposed mice, the stimulation current required to achieve the eEPSC threshold was greater in MSNs from amphetamine-treated mice on WD 10 and WD 21. **p < 0.01 compared with saline, Student's t test. E, Representative traces (top) and input-output curves show that cortical stimulation produced lower-amplitude eEPSCs in MSNs on WD 10 and WD 21. @p < 0.05, saline compared with either WD 10 or WD 21, 2-way ANOVA. F, Cortical stimulation intensity required to achieve 25%, 50%, and 75% of maximum eEPSC amplitude was greater in MSNs from amphetamine-treated mice on WD 10 and WD 21. *p < 0.05 compared with saline, Bonferroni t test. G, Example traces (top) and quantified AMPAR/NMDAR response ratios show equivalent isolated AMPAR (black) and NMDAR-mediated (gray) eEPSCs measured in MSNs from saline-treated mice (left) and amphetamine-treated mice (right) on WD 10. H, Representative traces (top) and graph show that the PPR is lower in MSNs from saline-exposed mice (left) compared with amphetamine-treated mice in withdrawal (right). **p < 0.01, Student's t test. I, Representative traces (top) show mEPSCs recorded in MSNs from saline- (left) and amphetamine-treated mice on WD 10 (right). Amphetamine in vitro did not change the mean mEPSC frequency (inset) or frequency distribution. J, The average amplitude (inset) and cumulative amplitude distribution of mEPSC from saline-exposed mice was similar to that of amphetamine-treated mice on WD 10. K, Representative traces (top) of mEPSCs obtained from MSNs in the nucleus accumbens shell 10 d after treatment with saline (left) or amphetamine (right). Exposure to repeated amphetamine reduced high-frequency, small-amplitude inward currents, but did not change the average mEPSC frequency (inset) on WD 10. **p < 0.01 compared with saline, paired t test. L, Exposure to amphetamine increased the amplitude of mEPSCs in the nucleus accumbens shell on WD 10. *p < 0.05, **p < 0.01 compared with saline, paired t test. Scale bars in C, 1 mm; E, H, 100 pA, 5 ms; G, 100 ms; I, K, 10 pA, 1 s. Curves were fit with a Hill equation.

