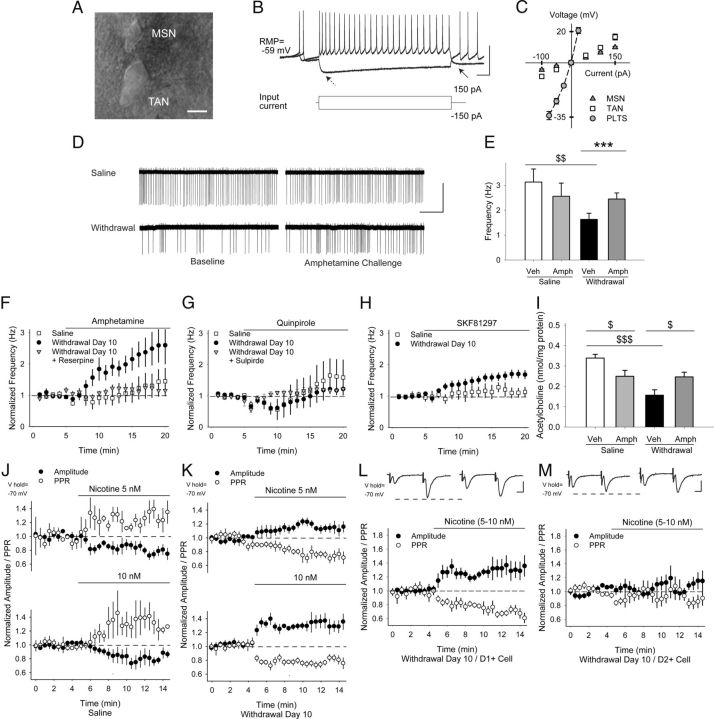
Figure 9.
TAN firing is reduced in withdrawal and increases via D1Rs after an amphetamine challenge in withdrawal. A, Differential interference contrast image showing a cell-attached TAN adjacent to a smaller MSN. B, Typical response of TANs to depolarizing and hyperpolarizing current injections. Arrows show characteristic “sag” (left) and after-hyperpolarization (right). C, Current–voltage graph comparing nonrectifying responses in TANs with quiescent, rectifying MSNs and with sometimes spontaneously active persistent low-threshold spike (PLTS) GABA interneurons (note that data for PLTS cells was obtained from Wang et al., 2013). D, Representative traces from experimental results in E showing cell-attached recordings in saline- and amphetamine-treated TANs. Baseline firing frequencies were reduced in withdrawal, but increased after an amphetamine challenge. E, Baseline firing frequencies in saline- and amphetamine-treated TANs. Amphetamine had little effect on saline-exposed mice, but increased firing frequencies in TANs from amphetamine-treated mice. $$p < 0.01, Student's t test and ***p < 0.001, paired t test. F, Normalized TAN firing rates in saline- and amphetamine-treated mice on WD 10 showing response to amphetamine in vitro and after treatment with reserpine. G, Normalized firing frequencies of TANs from saline- and amphetamine-treated mice on WD 10 in response to the D2R agonist quinpirole. Both the depression and rebound increase in cell firing was blocked by the D2R antagonist sulpiride. H, Normalized firing frequencies of TANs from saline- and amphetamine-treated mice on WD 10 in response to the D1R agonist SKF81297. I, Acetylcholine content was reduced in striatal tissue from amphetamine-sensitized mice on WD 10. Amphetamine in vivo on WD 10 reduced acetylcholine content in saline-exposed mice, but increased acetylcholine content in amphetamine-treated mice. $p < 0.05, $$$p < 0.001, Student's t test. J, Normalized amplitude and PPR in response to cortically evoked paired pulses. In MSNs from saline-exposed mice, nicotine (5 nm, n = 6, top; 10 nm, n = 4, bottom) applied by puff pipette reduced the amplitude (of the first pulse) and increased the PPR. K, In MSNs from amphetamine-treated mice, nicotine (5 nm, n = 6, top; 10 nm, n = 9, bottom) increased the eEPSC amplitude and reduced the PPR. L, Representative traces (top) in D1+ and M, D2+ MSNs on WD 10 show the average responses of paired pulses before (left) and 5 min after puff application of nicotine (5–10 nm; right). Nicotine increased the amplitude of the first eEPSC and reduced the PPR in D1+ MSNs, but had no effect on the eEPSC amplitude or the PPR in D2+ MSNs. Scale bars in A, 10 μm; B, 50 mV, 100 ms; D, 100 pA, 5 s; L, M, 100 pA, 5 ms.

