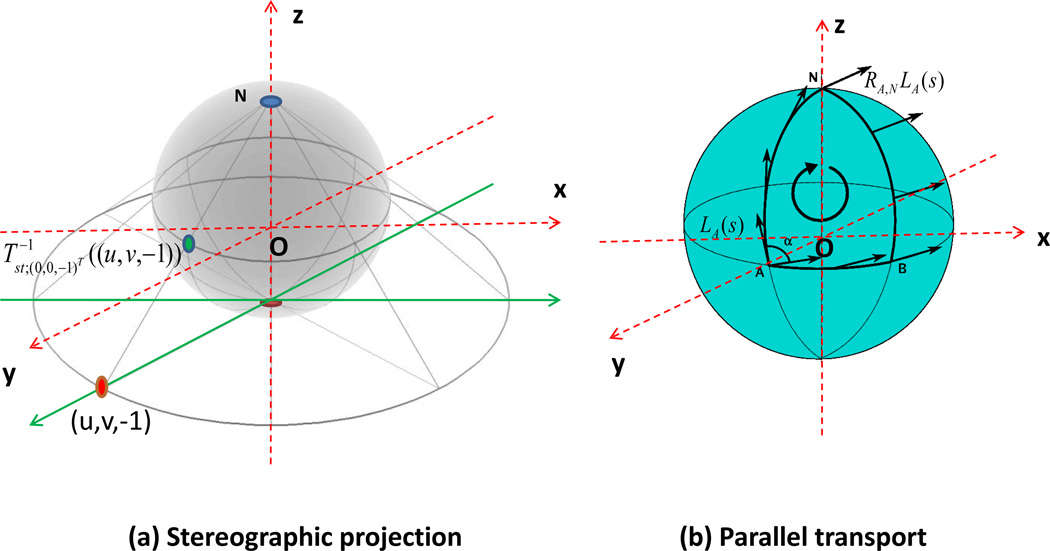
Figure 2.
Graphic illustration of (a) stereographic projection and (b) parallel transport. In panels (a) and (b), N and O denote the north pole (0, 0, 1) and the origin (0, 0, 0), respectively, and the red dash lines are the x, y, and z-axes. In panel (a), the red point (u, v, −1) is a selected point on the plane z = −1 and the green point is the inverse map of the stereographic projection mapping from (u, v, −1) back to S2. In panel (b), the point A is on S2, LA(s) is in TAS2, and RA,NLA(s) ∈ TNS2 is the parallel transport of LA(s) from A to the north pole N.

