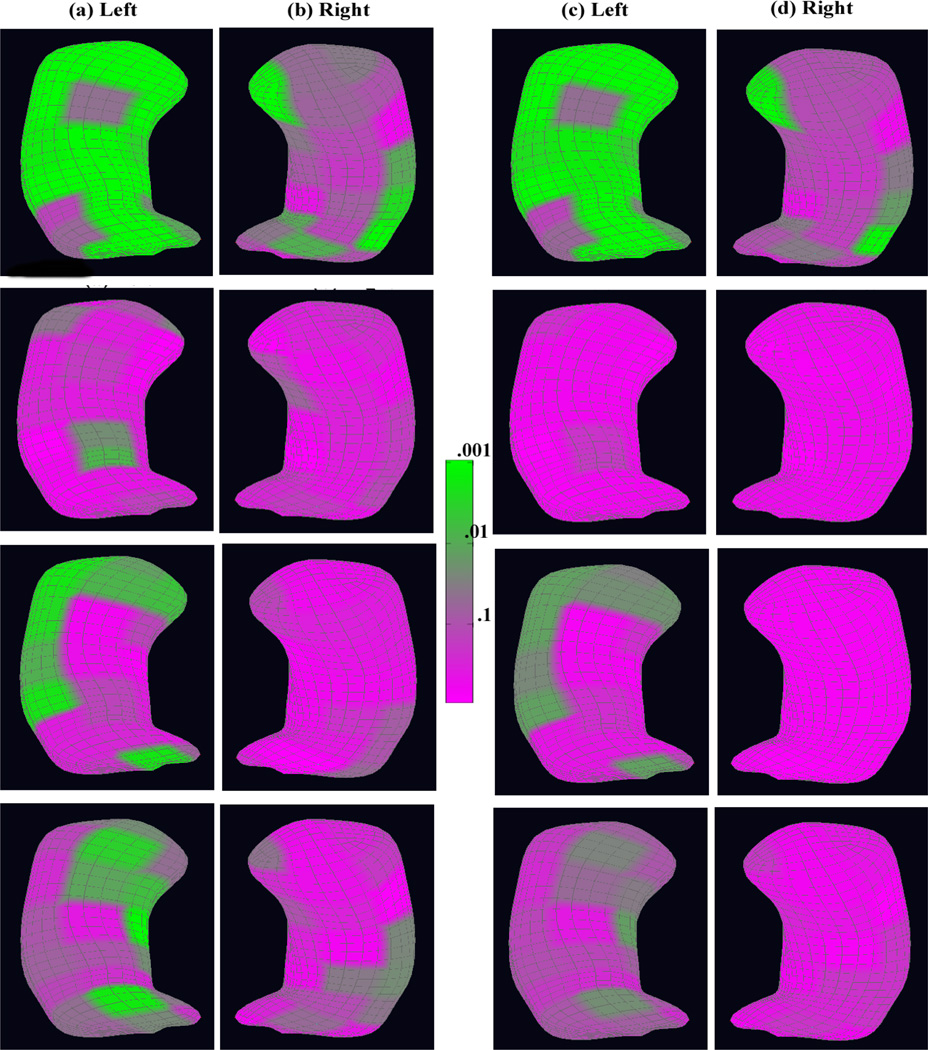
Figure 3.
The coded p–value maps of the diagnostic status effects from the schizophrenia study of the hippocampus: rows 1, 2, 3, and 4 are for the whole medial representation structure, radius, location, and two directions, respectively: at each row, the uncorrected p–value maps for (a) the left hippocampus and (b) the right hippocampus; the corrected p–value maps for (c) the left hippocampus and (d) the right hippocampus after correcting for multiple comparisons.

