
Figure 9.
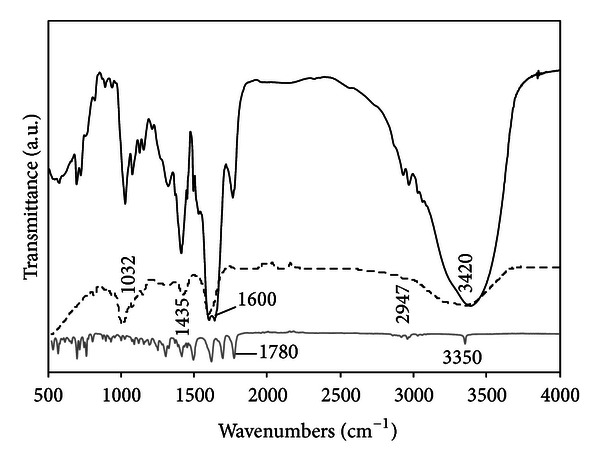
The FTIR spectroscopy of unloaded alginate/OSA starch beads (dashed line), PenG (grey line), and PenG/alginate/OSA starch microspheres (black line).
Official websites use .gov
A
.gov website belongs to an official
government organization in the United States.
Secure .gov websites use HTTPS
A lock (
) or https:// means you've safely
connected to the .gov website. Share sensitive
information only on official, secure websites.
The FTIR spectroscopy of unloaded alginate/OSA starch beads (dashed line), PenG (grey line), and PenG/alginate/OSA starch microspheres (black line).