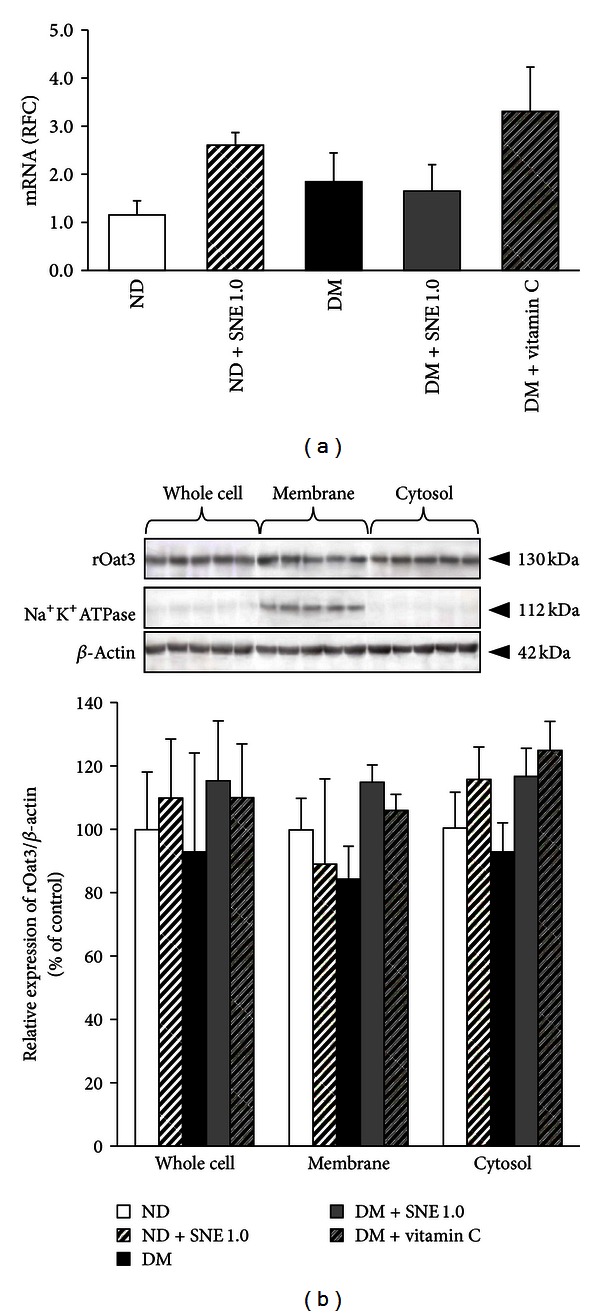
Figure 6.

Renal rOat3 mRNA and protein expressions. (a) mRNA expressions of rOat3 from ND, ND + SNE1.0, DM, DM + SNE1.0, and DM + vitamin C rat kidneys. Total RNA was extracted from rat cortical tissues and mRNA levels were measured using quantitative real-time PCR (qPCR). The data are expressed as mean ± S.E.M. and repeated from separate animals (n = 6). (b) Western blot analysis of rOat3 protein expression in subcellular fractions from rat renal cortex. Whole cell lysate, membrane, and cytosolic fractions were extracted from rat renal cortical tissues. The samples were then separated using electrophoresis and western blotting. Anti-rOat3 antibody was subsequently detected whereas anti-Na+-K+-ATPase and anti-β-actin antibodies were also used as a membrane marker and loading control, respectively. The data are expressed as mean ± S.E.M. and repeated from separate sets of animals (n = 6). A representative blot of rOat3 protein expression is shown in (top (b)) and quantification of relative rOat3/β-actin protein expression in each fraction is presented in (bottom (b)).
