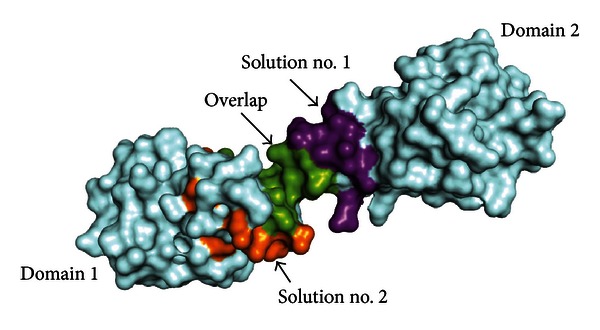
Figure 2.

Epitope mapping results from mimotope analysis. Residues only appearing in solutions nos. 1 and 2 are colored in purple and orange, respectively; the overlapping region of the two solutions is drawn in green. All other parts of CD147 surface are presented in pale cyan.
