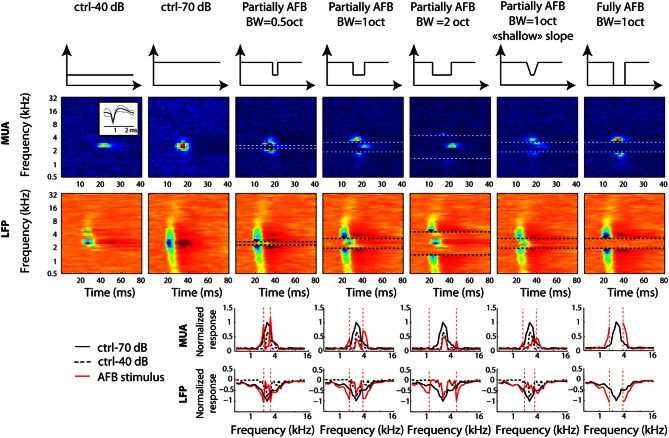
Figure 2.
Neural tuning of individual recordings obtained from one selected example at a given location in primary auditory cortex. First row: long-term spectrum of all stimulus conditions. Each column corresponds to a stimulus condition. Second and third rows: STRFs derived from MUA and LFPs, respectively. Horizontal dotted lines represent the edge frequencies of the notch. Inset in the first column and second row represents the averaged waveform (±2 standard deviations) for the MUA at that particular location. Fourth and fifth rows: frequency “profile” obtained by taking the maximum firing rate of MUA, or by taking the minimal amplitude of LFPs, in the 10–40 ms time window, respectively. Vertical dotted lines represent the edge frequencies of the AFB. In order to permit direct comparison of neural responses between control and AFB conditions (red lines), the ctrl-70 (black lines) and ctrl-40 (dotted lines) conditions are added to each figure. Neural responses are greatly enhanced at the edges of the notch and decreased within the notch. The largest increase of responses is observed for the sharp contrast and the full-notch conditions (seventh column).

