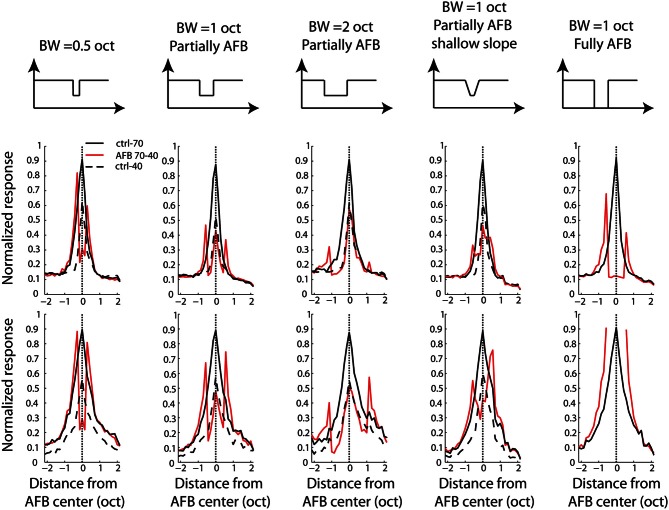
Figure 4.
Average frequency profile for all stimulus conditions, for one BF position relative to the AFB center (neural BF corresponding to the AFB center) for MUA (first row) and LFPs (second row). Frequency profiles are obtained by taking the maximal normalized firing rate (for MUA, or the minimal normalized amplitude for LFPs) between 10 and 40 ms after stimulus onset. Each column corresponds to an AFB condition. Schematics illustrating the long-term spectrum of the acoustic conditions are shown at the top of the figure. First column: half-an-octave partially AFB. Second column: one-octave partially AFB. Third column: two-octaves partially AFB. Fourth column: shallow-slope partially condition. Fifth column: fully AFB. Both control conditions (at 70 dB SPL, continuous black line and at 40 dB SPL, dashed black line) are shown in all panels to permit a direct comparison between control and AFB conditions (red line). Neural responses were greatly enhanced at both edges of the notch, and reduced within the notch. The neural enhancement at both edges of the AFB was sensitive to the sharpness and the depth of the spectral contrast (compare 2nd and 4th columns, and 2nd and 5th columns, respectively).

