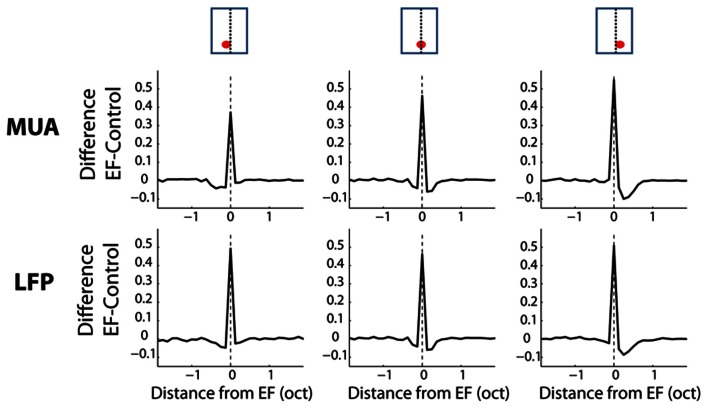
Figure 9.
Average difference between the stimulus condition with an EF and the control conditions for three positions of the EF relative to the neural BF, as a function of frequency. Each column represents a position of the EF relative to the neural BF. At the top of the figure, schematics illustrate all stimulus conditions, namely the location of the receptive field relative to the EF (see text for more details). First column: average data for neurons with BF lower than the EF. Second column: average data for neurons with BF corresponding to the EF. Third column: average data for neurons with BF higher than the peak frequency. One notes the neural suppression at frequencies adjacent to the peak frequency and the asymmetry of this neural suppression (suppression is stronger from low to high frequencies).

