
Figure 3.
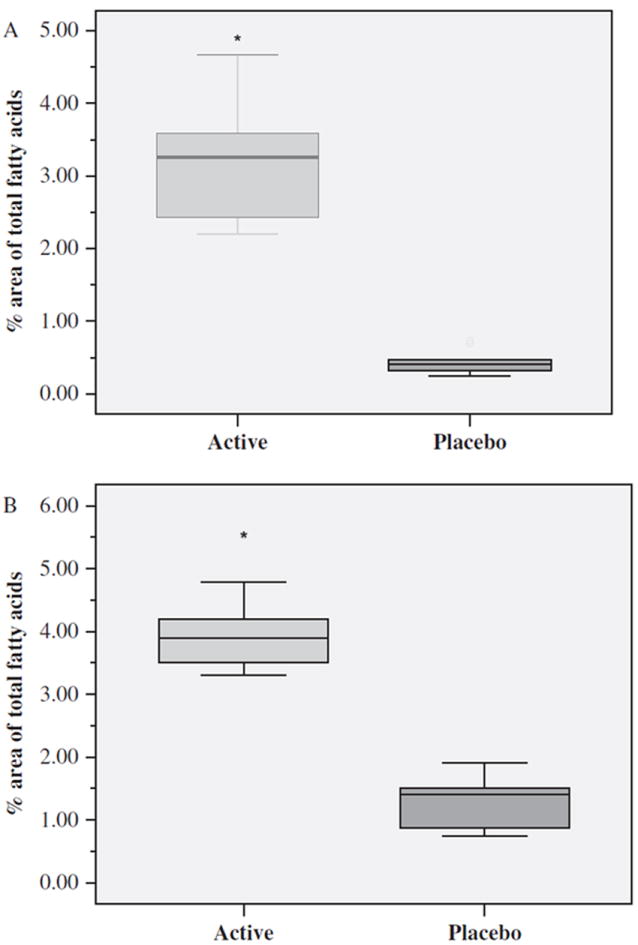
Mean distribution levels of plasma EPA (A) and DHA (B) after 4 weeks of supplement or placebo by Active (n=9) and Placebo (n=9) Groups expressed as percentage area of total fatty acids. Boxes define the middle 50% of the distribution for each group. The vertical line crossing each box defines the median. Upper and lower bars represent the largest and smallest values that are not outliers. *p < 0.001 Active vs. Placebo Group. EPA, eicosapentaenoic acid; DHA, docosahexaenoic acid.