
Figure 4.
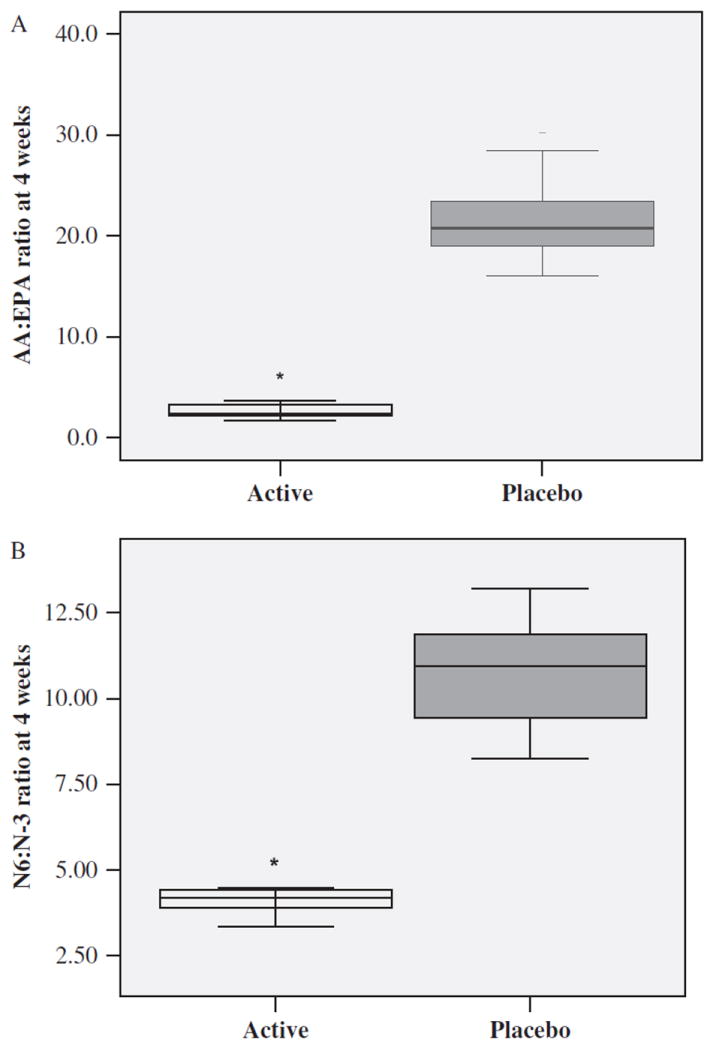
AA : EPA ratio (A) and n-6 : n-3 PUFA ratio (B) after 4 weeks of supplement or placebo by Active (n=9) and Placebo (n=9) Groups. Each box defines the middle 50% of the distribution. The vertical line crossing each box defines the median. Upper and lower bars represent the largest and the smallest values that are not outliers. *p < 0.001 Active vs. Placebo Group. AA, arachidonic acid; EPA, eicosapentaenoic acid; PUFA, polyunsaturated fatty acids.