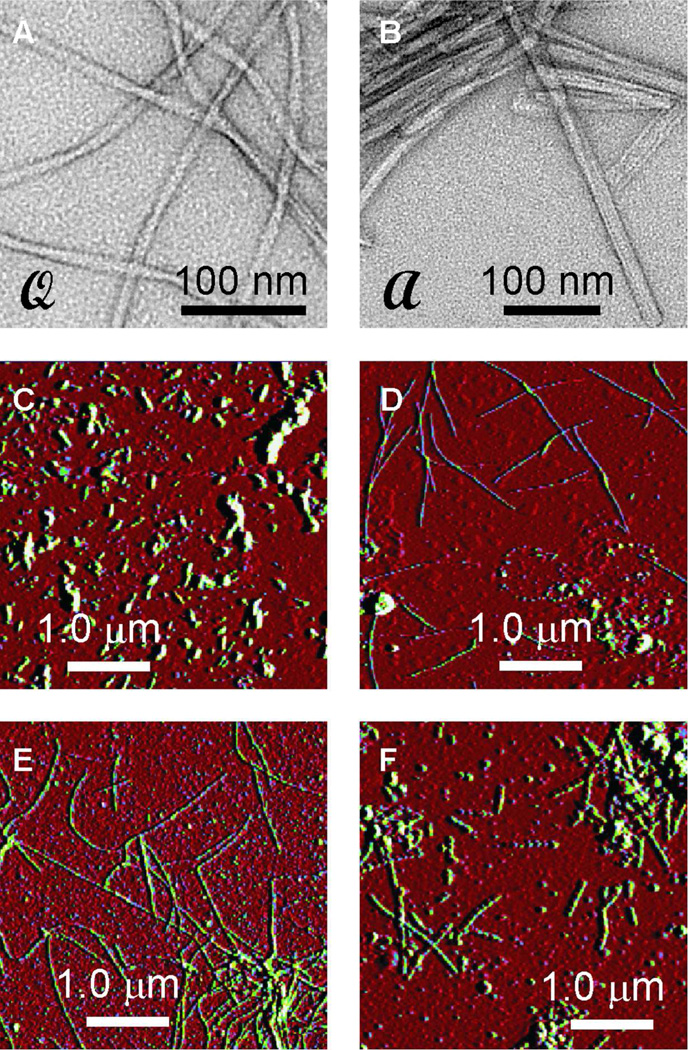
Figure 1.
(A,B) Negatively stained TEM images of "quiescent" and "agitated" Aβ1–40 fibrils (called  and
and  fibrils), showing their distinct morphologies. These fibrils resulted from seeded growth at 24° C, using 50 µM initial monomer concentrations. (C,D) Representative AFM images of
  fibrils from elongation measurements after 0 and 20 min incubation, respectively. Measurements were done at 24° C with 50 µM soluble Aβ1–40 concentration. (E,F) Representative AFM images of
  fibrils from shrinkage measurements at 24° C after 2 hr and 46 hr incubation, respectively. Vertical scales represent AFM feedback error signals, not height.

