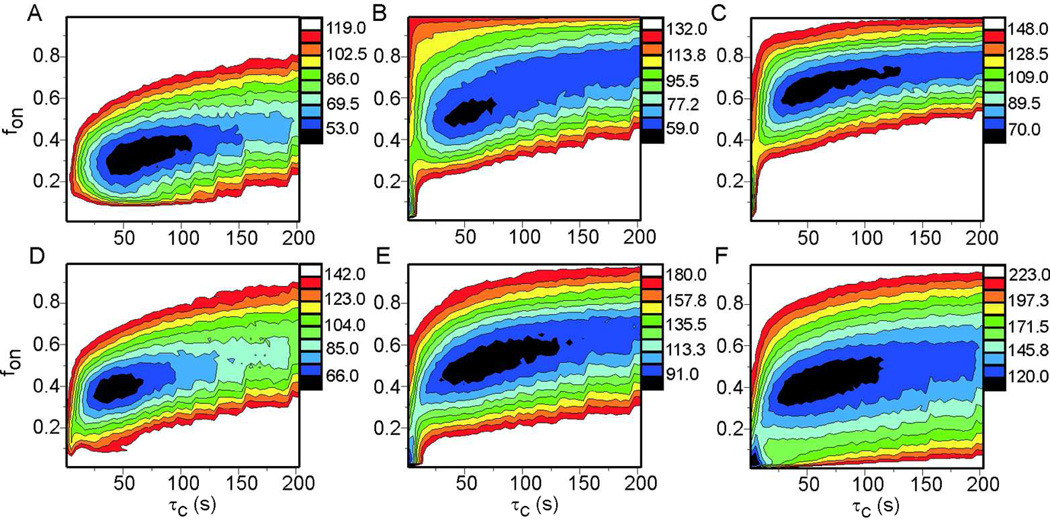
Figure 6.
Contour plots of the deviation between experimental and simulated histograms of Aβ1–40 fibril length distributions in fibril elongation measurements at 24° C, as a function of the correlation time (τc) and elongation fraction (fon) assumed in the simulations. (A,B,C)  fibrils with 25 µM, 50 µM, and 75 µM soluble Aβ1–40 concentrations, respectively. (D,E,F)
  fibrils with 25 µM, 50 µM, and 75 µM soluble Aβ1–40 concentrations, respectively. Each contour plot represents the average of 50 independent simulations with different random numbers to determine switching of fibrils between "on" and "off" elongation states. In each plot, the contour level increment was set to where was the minimum total squared deviation between simulated and experimental histograms.

