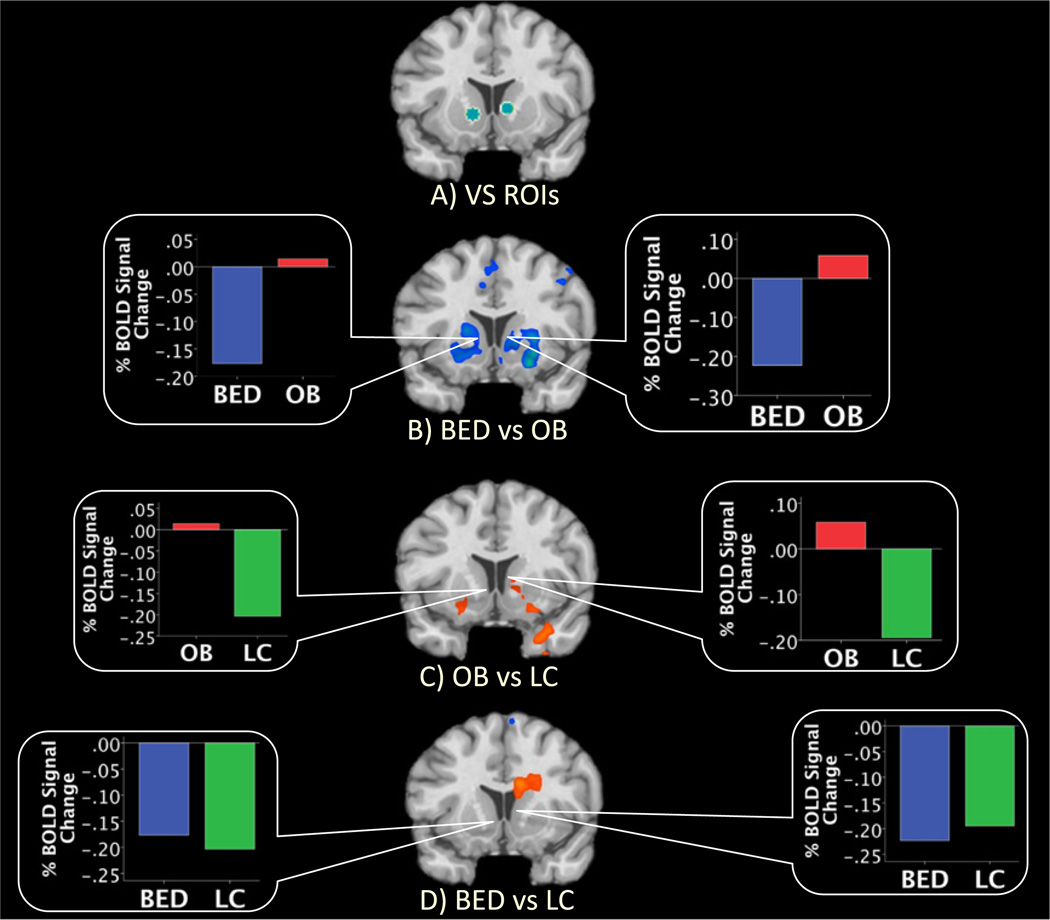
Figure 2.
Coronal view of ventral striatal regions of interest (ROIs) with coordinates reported by Knutson and Greer (43). (A) Blue spots indicate a 5-mm sphere around the ventral striatum on the left [−12, 10,−2] and right [10, 8, 2] sides. (B) Coronal slice y = 10 demonstrates whole brain contrast between BED and OB groups during the A2 winning phase. Graphs depict percentage blood oxygen level–dependent (BOLD) signal change extracted from each 5-mm ROI on the right and left sides for the BED (blue) and OB (red) groups. (C) Coronal slice y = 10 demonstrates whole brain contrast between OB and LC groups during the A2 winning phase. Graphs depict percentage BOLD signal change extracted from each 5-mm ROI on the right and left sides for the OB (red) and LC (green) groups. (D) Coronal slice y = 10 demonstrates whole brain contrast between BED and LC groups during the A2 winning phase. Graphs depict percentage BOLD signal change extracted from each 5 mm ROI on the right and left sides for the BED (blue) and LC (green) groups. The right side of the brain is on the right. Abbreviations as in Figures 1 and 2.

