
Figure 1.
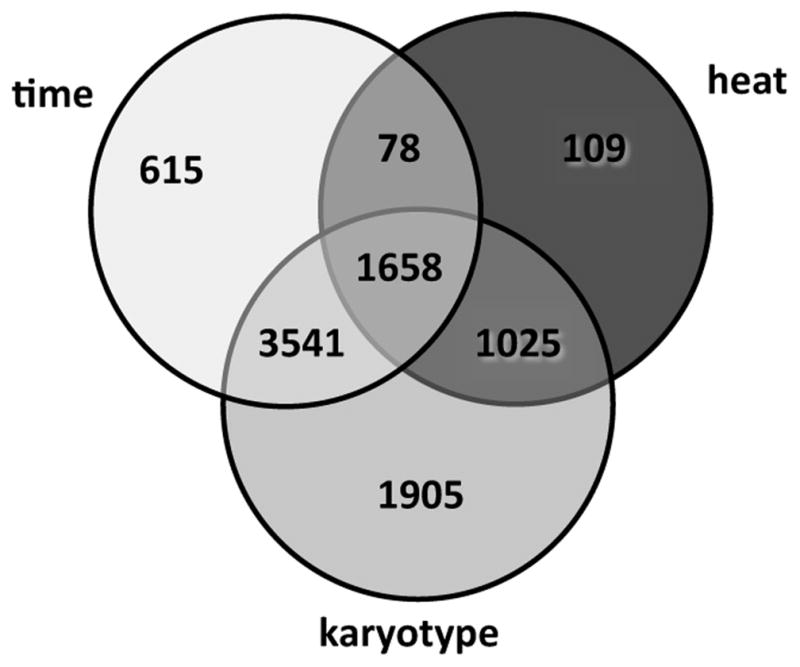
Venn diagram indicating the number of An. gambiae genes differentially expressed as a function of heat stress, karyotype, time, or their interactions, based on ANOVA (FDR < 0.1).
Official websites use .gov
A
.gov website belongs to an official
government organization in the United States.
Secure .gov websites use HTTPS
A lock (
) or https:// means you've safely
connected to the .gov website. Share sensitive
information only on official, secure websites.
Venn diagram indicating the number of An. gambiae genes differentially expressed as a function of heat stress, karyotype, time, or their interactions, based on ANOVA (FDR < 0.1).