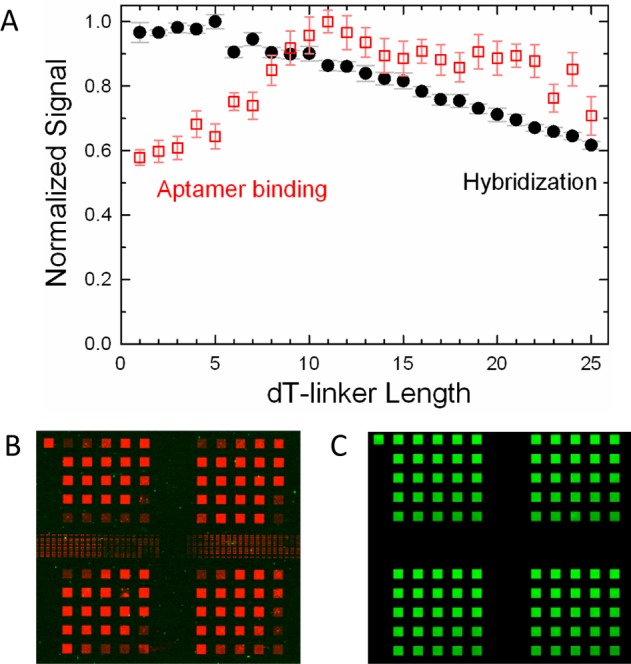
Figure 1.

(A) Normalized fluorescent signals vs linker length from the St-2-1 aptamer binding assay (red empty squares), and from the equivalent 25mer hybridization experiment. (B) Microarray image of aptamer linker gradient showing four replicates and with the length increasing from left to right and from top to bottom in 25 steps from 1 to 25 dTs. (C) Equivalent image of hybridization experiment. Each of the square features on the microarray is synthesized using a 10 × 10 array of 16 μm DMD mirrors.
