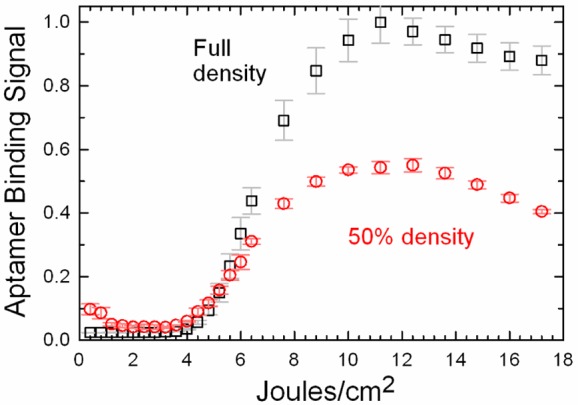
Figure 3.

Normalized streptavidin binding signal for a St-2-1 aptamer sequence synthesized with a photodeprotection light exposure gradient between 0.2 and 18 J/cm2. The black squares represent data from a microarray synthesized with a maximum surface density of oligonucleotides. The red circles are from an equivalent experiment, but with a microarray with an oligonucleotide surface density reduced by 50%.
