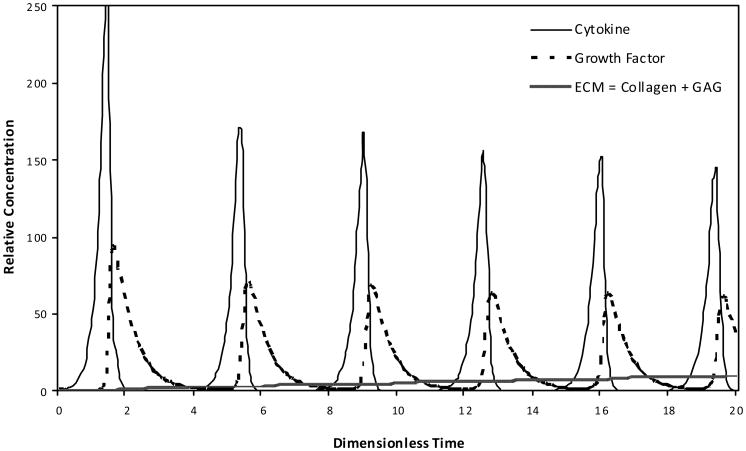
Figure 5. Absolute production of the total ECM based on the modelled collagen and GAG molecule accumulation as influenced by the cyclic, phase-shifted anabolic and catabolic contributions of growth factor and cytokine, respectively.
Note: The influence and production are shown during early (A) and late (B) dimensionless time periods, where the distinct amounts of collagen and GAG are indicated during the later time.

