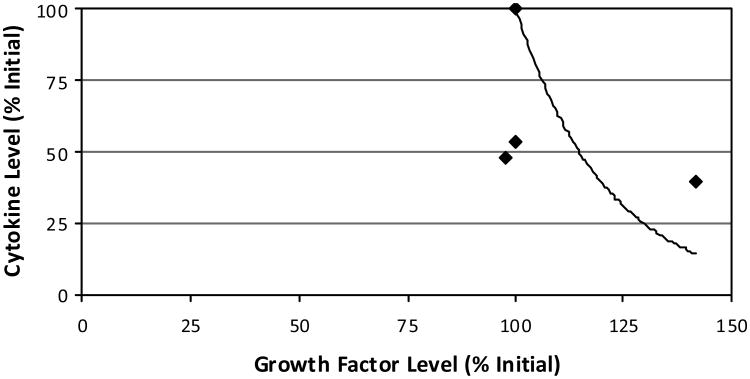
Figure 6. For comparison with this study, the relative influence of cytokine and growth hormone levels as measured during a recent human hernia healing study are shown.
Notes: Values represent daily means (four days total) of each of the seven cytokine and two growth factor types measured. As culture time passes, an inverse relationship is described moving from the upper left data (100% of the initial levels) to the lower right data. By fixing the trendline to the initial-state data points, the fitted curve can be defined relating cytokines (y) to growth factors (x) as y = 10826e−0.0468x.
Source: Di Vitta et al. (2006)

