
Figure 3.
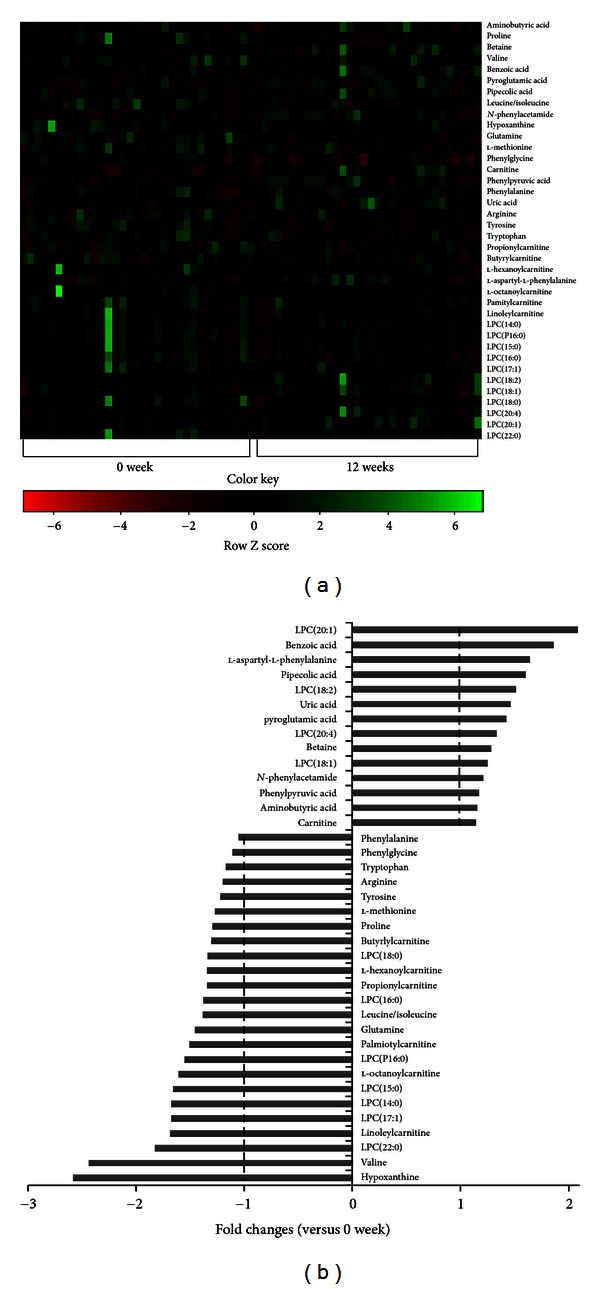
Heat map of the identified serum metabolites from the human subjects showing significant differences among samples (a) and their fold changes at weeks 0 and 12 of intervention (b). The heat map was drawn by R with g plots. The fold changes of serum metabolites in subjects at 12 weeks were calculated against those at 0 week and are presented as positive and negative values.