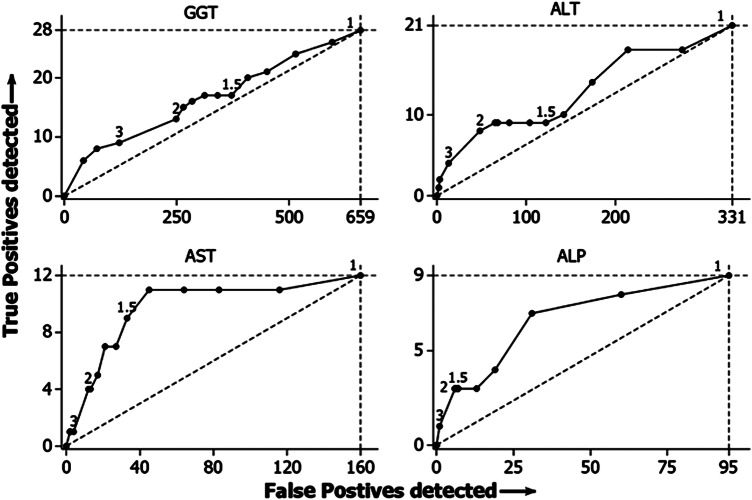
Figure 2.
The effect of increasing the threshold of abnormality for four analytes. Numbers of True Positives (ie, patients in categories 1, 2 or 3 with analyte concentration above the threshold) are plotted against numbers of False Positives, using thresholds set at fixed multiples of the current laboratory reference limit. Points are plotted at intervals of 0.1 up to twice the reference limit, and at 3, 4 and 5 times the limit. Points at 1, 1.5, 2 and 3 times the limit are labelled accordingly.

