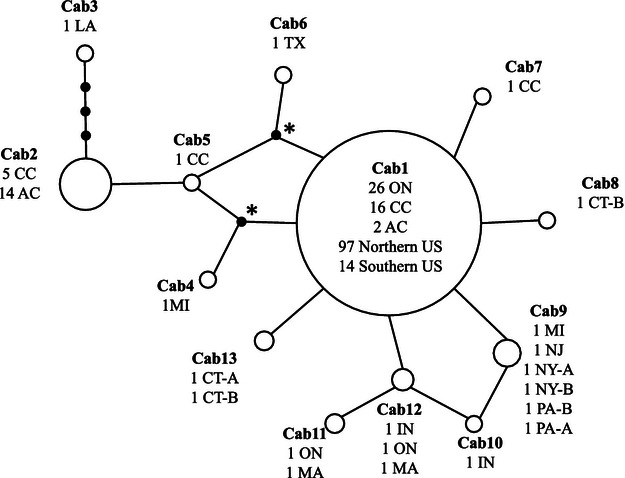
Figure 3.

Statistical parsimony network of all three sequenced regions combined (intergenic spacers atpF-atpH, trnH-psbA, and trnL-trnF) displaying the final 13 haplotypes (Cab1-13) and the frequency of detection. Small black dots represent missing haplotypes, and those marked with an asterisk are a 4 bp mutation.
