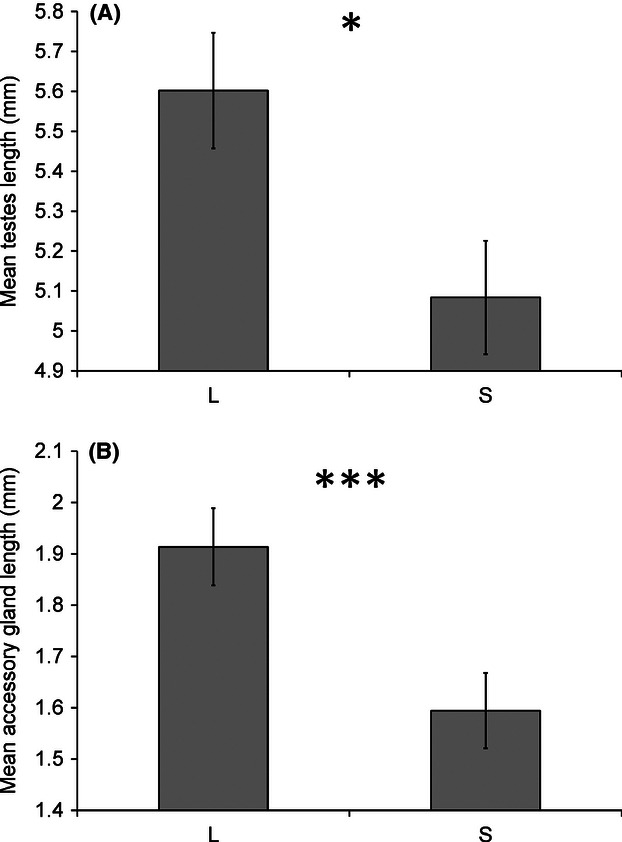
Figure 3.

The relationship between (A) male eyespan class (L and S) and mean testis length (mm), and (B) male eyespan class (L and S) and mean accessory gland length (mm). Error bars show ± SEM. Degree of significance is shown using asterisks (*P < 0.05; ***P < 0.001).
