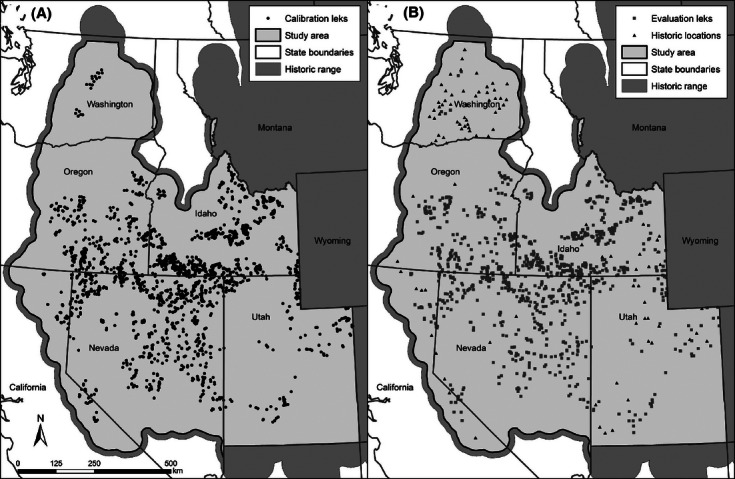
Figure 3.

Distribution of greater sage-grouse lek locations active between 1998 and 2007 in the western range used to calibrate and evaluate models. Leks were randomly selected into calibration (A, black circles) and evaluation subsets (B, gray squares). Historic, but currently unoccupied sage-grouse locations (B, black triangles) were also used to test model performance.
