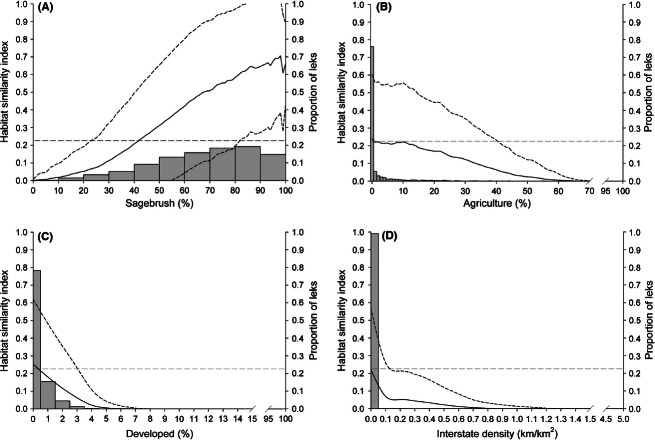
Figure 5.
Changes in the habitat similarity index (HSI) relative to (A) sagebrush, (B) agriculture, (C) developed lands, and (D) density of interstate highways in the landscape within 5 km. Mean HSI values for study area (black line, ±1 SD [stippled lines]) and proportion of total leks (gray bars) were calculated for each increment of the environmental variables. Range of environmental variable values relates to the values within the study area. The dashed horizontal line indicates the HSI value (0.22) above which characterizes 90% of active leks.

