
Figure 5.
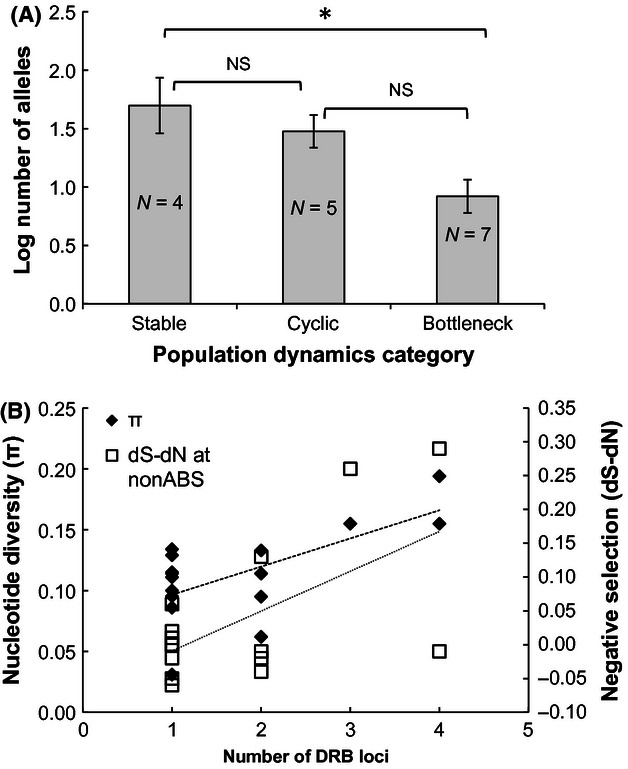
Interspecific trait effects on signals of selection and nucleotide diversity at the DRB in 16 rodent species. (A) Relationship between population dynamics categorized as stable, cyclic, and bottlenecked, and DRB allelic richness. N indicates sample size and error bars indicate 95% confidence intervals. (B) Relationship between the number of DRB loci per species and average nucleotide divergence (π, black diamonds) and strength of purifying selection (dS–dN at non antigen binding sites, open squares). For the secondary y-axis, zero indicates equal rates of synonymous and nonsynonymous substitutions, while positive values indicate negative selection for amino-acid changing substitutions. The black dotted line is the linear best fit for π, and the gray dotted line is the linear best fit for “purifying selection.”