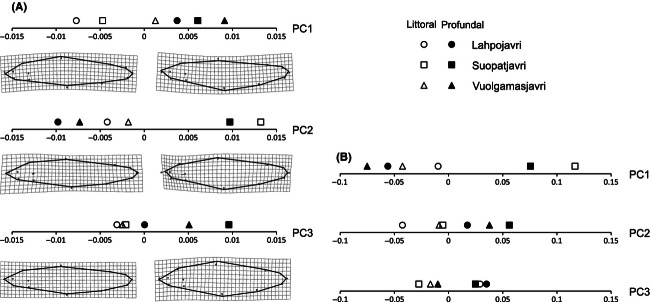
Figure A1.

Mean values for littoral and profundal resource specialists in each of the three lakes along the first three PC-axes from PCA of a) shape variables and b) ten linear morphological traits. Shape changes along the PC-axes are illustrated (a) using thin-plate spline transformations of the mean shape in the most extreme populations relative to the overall mean shape. Shape changes are magnified 3 times for easier interpretation. The landmark vectors show the relative magnitude of change in the location of each landmark, with the points representing the overall mean shape, and lines pointing in the direction of the lake-specific morphology. Solid lines between ends of vectors are drawn to aid interpretation. The importance of individual linear traits on each PC-axes in b) is presented in Appendix Table A2.
