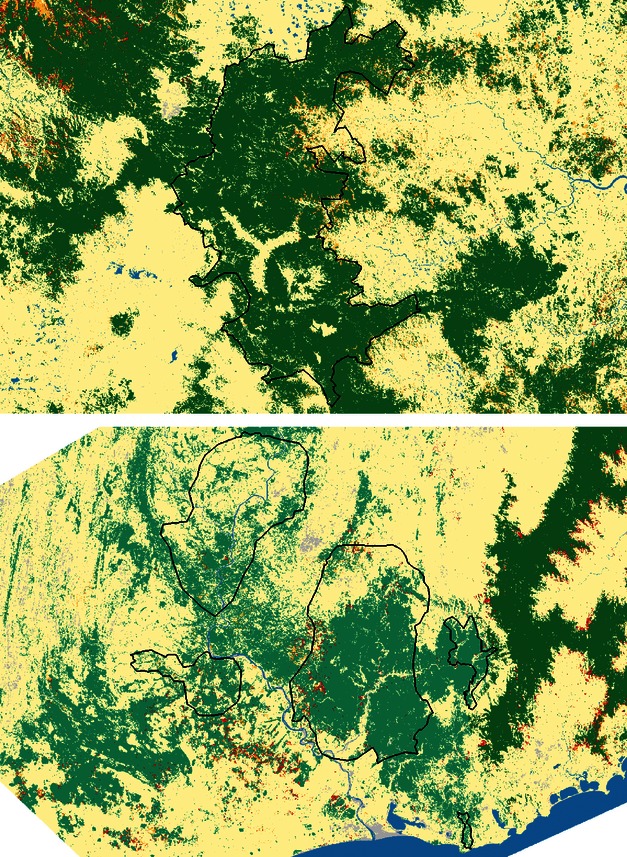
Figure 3.

Historical deforestation at project sites 1 and 5 in the humid and spiny-dry forest. Patches of forest deforested between dates t0 and t1 are in orange, while patches of forest deforested between dates t1 and t2 are in red. Remaining forest is in dark green (humid forest) and light green (spiny-dry forest).
