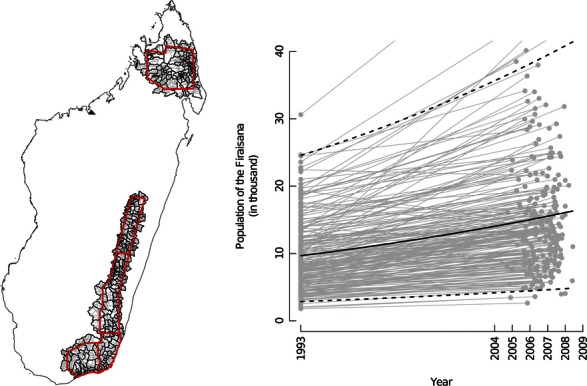
Figure 4.

Demographic model from population census data. The exponential model was fitted on the population census data from the RGPH (“recensement général de la population et de l'habitat”) for Firaisana in 1993 combined with a more recent population census data acquired between 2004 and 2009 for Fokontany. In the figure on the left, the delimitation of Firaisana (black lines) and Fokontanys (gray lines) covering our study areas (red lines) are represented on the map of Madagascar. In the figure on the right, population growth in each Firaisana is represented by two gray dots connected by a gray line. The mean exponential growth population model is represented by a plain black line. The mean population growth rate was estimated to be 3.39%.year−1. The 95% confidence envelop including the Firaisana variability is represented by dashed black lines.
