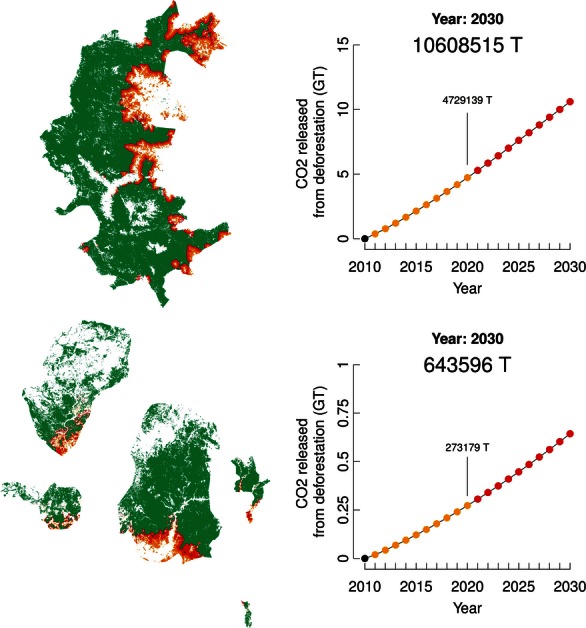
Figure 5.

Forecast of anthropogenic deforestation and carbon dioxide emissions. Forecasts are shown for the Andapa project site in the humid forest (top figure) and for the Fort-Dauphin II project site in the spiny-dry forest (bottom figure). Patches of deforestation and carbon dioxide emissions for the period 2010–2020 are in orange and for the period 2020–2030, in red. The forest remaining in 2030 is in dark green. Carbon dioxide emissions correspond to the loss of aboveground biomass due to deforestation and do not include belowground biomass or soil carbon.
