Figure 4.

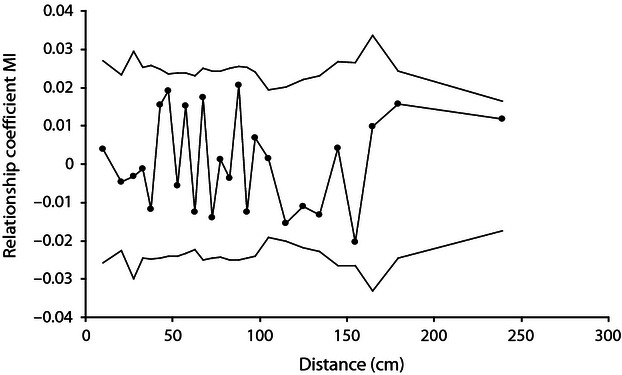
Correlogram (—•—) of the spatial autocorrelation analysis of Moran's I relationship coefficient (MI) over 26 distance categories. The 95% confidence intervals are represented.

Correlogram (—•—) of the spatial autocorrelation analysis of Moran's I relationship coefficient (MI) over 26 distance categories. The 95% confidence intervals are represented.