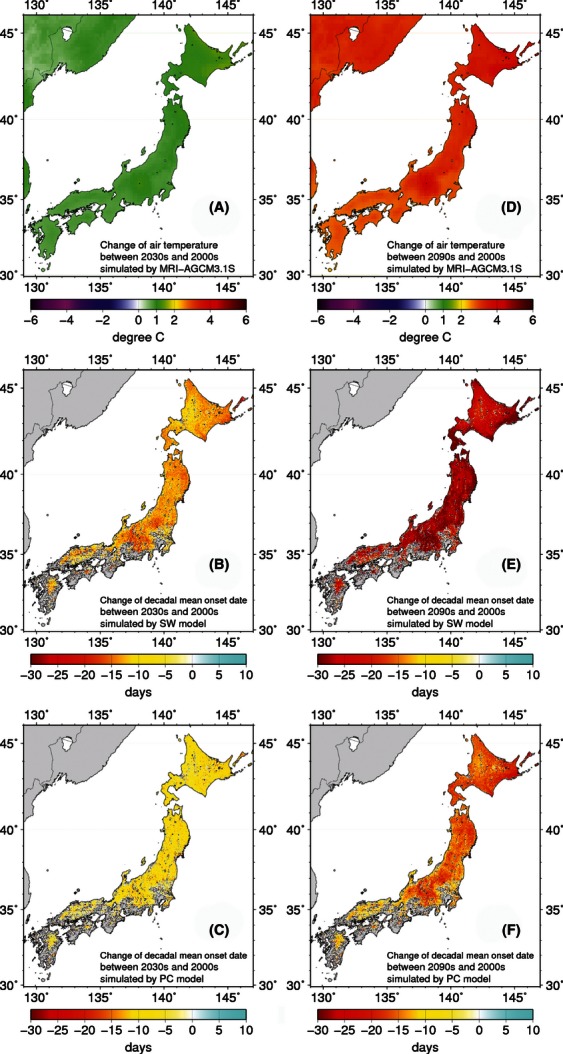
Figure 5.

The influences of predicted climate change on the spring leaf onset data simulated by the SW and PC models. (A–C) Changes between the first decade of the 2000s and the 2030s (values are 2030s minus 2000s). (D–F) Changes between the first decade of the 2000s and the 2090s (values are 2090s minus 2000s). (A, D) Changes of the annual mean temperature predicted by the MRI-AGCM3.1S model under the IPCC A1B scenario. Positive values represent higher temperatures (warming) in the future. (B, E) Changes in the spring onset date predicted by the SW (spring warming) model. Negative values represent earlier onset in the future. (C, F) Changes in the spring onset date predicted by the PC (parallel chill) model. Negative values represent earlier onset in the future.
