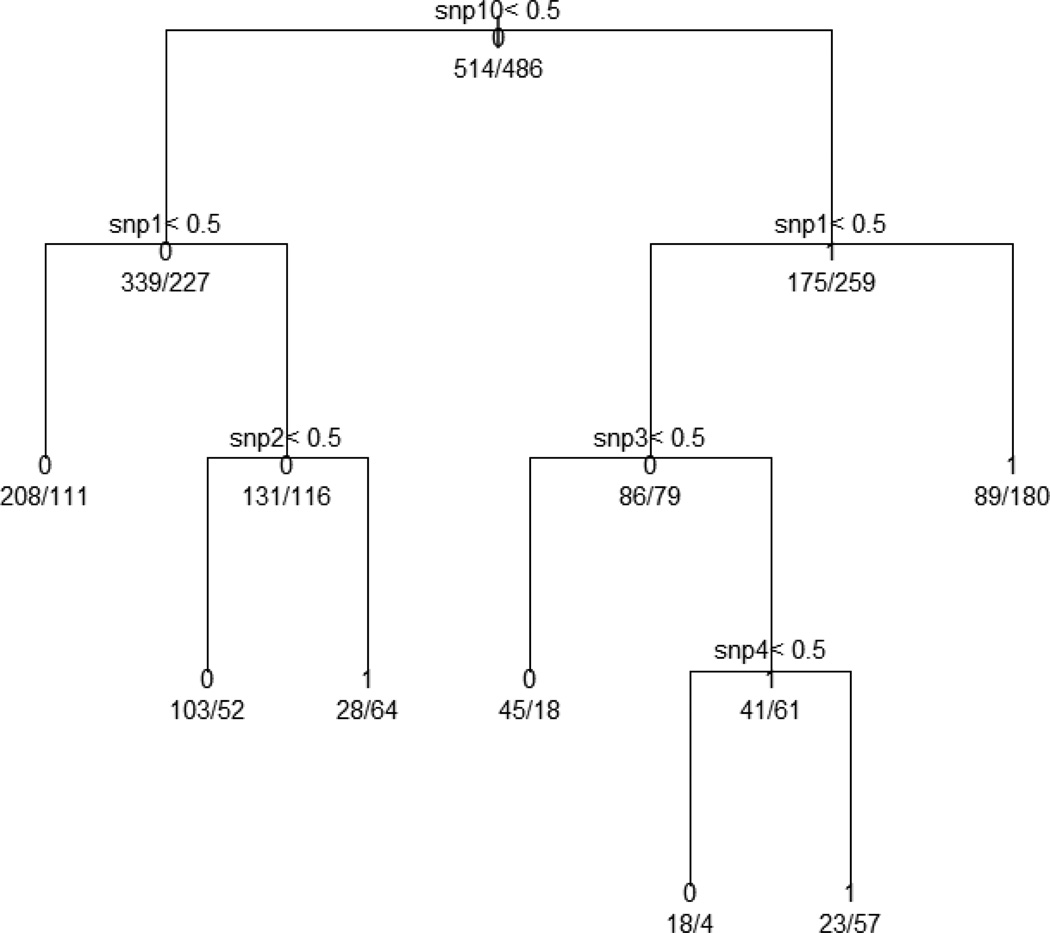
Figure 2.
Classification tree analysis of simulated data set including genetic risk factors and environmental factorsshowing cut-off values for snp10, snp1, snp2, snp3, and snp4. The target variable is the prevalence and the analysis produces seven terminals. The prevalence in the entire population was 48.6% (486/1000), and the first split is performed on snp10. This produces two subgroups with respective prevalence of 40.1% (227/566) and 59.7% (259/434).We investigated the subgroups with higher prevalence than the entire population. Among seven terminal nodes, only three were higher in prevalence than the entire population: the combination of snp10=1, snp1=0, snp3=1 and snp4=1 shows the highest prevalence (71.3%), the combination of snp10=0, snp1=1 and snp2=1 has the second highest prevalence (69.6%), the combination of snp10=1 and snp1=1 shows 66.9% in prevalence.

